Developing and implementing of information for WebGis (Action B3)
Sunday, 5 January 2020
Several maps were available on WebGis, such as those of radon and CO2 gases in the soil, Rn flux from soil, natural gamma radiation, and the geogenic
radon potential. Also the sites selected for installation of the RESPIRE remediation systems can be visualized by the WebGis interface (Figure 1).
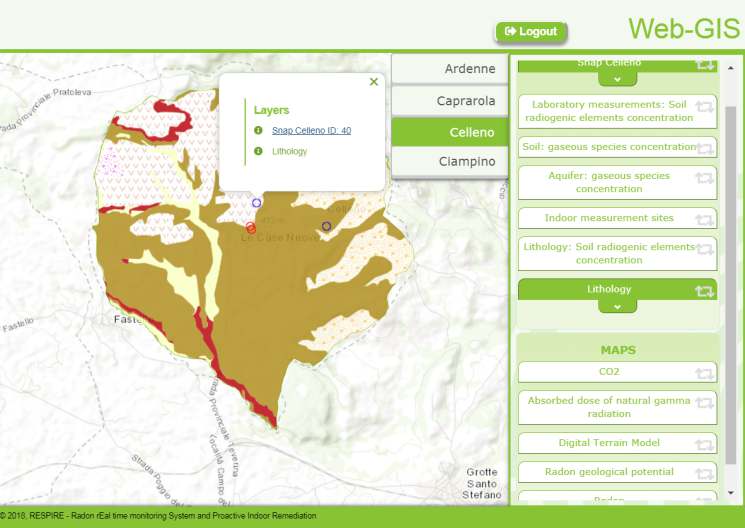
visualization in theWebGis interface.
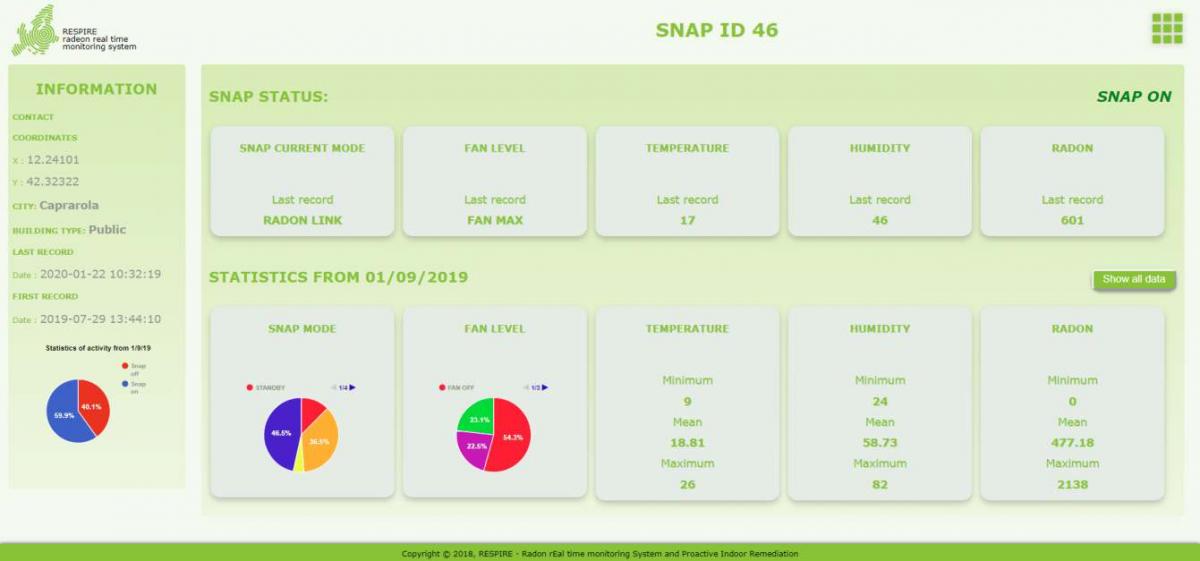
General information about each SNAP, the current status (e.g., the SNAP mode, the fan level, the last measurement of temperature, humidity and radon
level) and the long-time statistics can be visualized by the dashboard interface (Figure 2).