Monitoring result of the first remediation system (Action B3)
Data from the operating units that have functioned during periods from 3 to 8 months in different environments with different levels of radon concentrations, can be used to assess the radon concentration trends and the effectiveness of the developed system. Data can be visualised and downloaded by theWebGis interface. As example, the complete dataset recorded in the site “Celleno SNAP-40” is plotted in Figure 1. It shows the very high radon values (up to 1800 Bq/m3) that occur during the late winter period of March-April 2019, the very low values (< 50 Bq/m3) registered during the warmer summer period of August 2019 when the windows were often left open, and the steady rise in radon concentrations during the fall of 2019 (up to 1400 Bq/m3) as temperatures begin to fall.
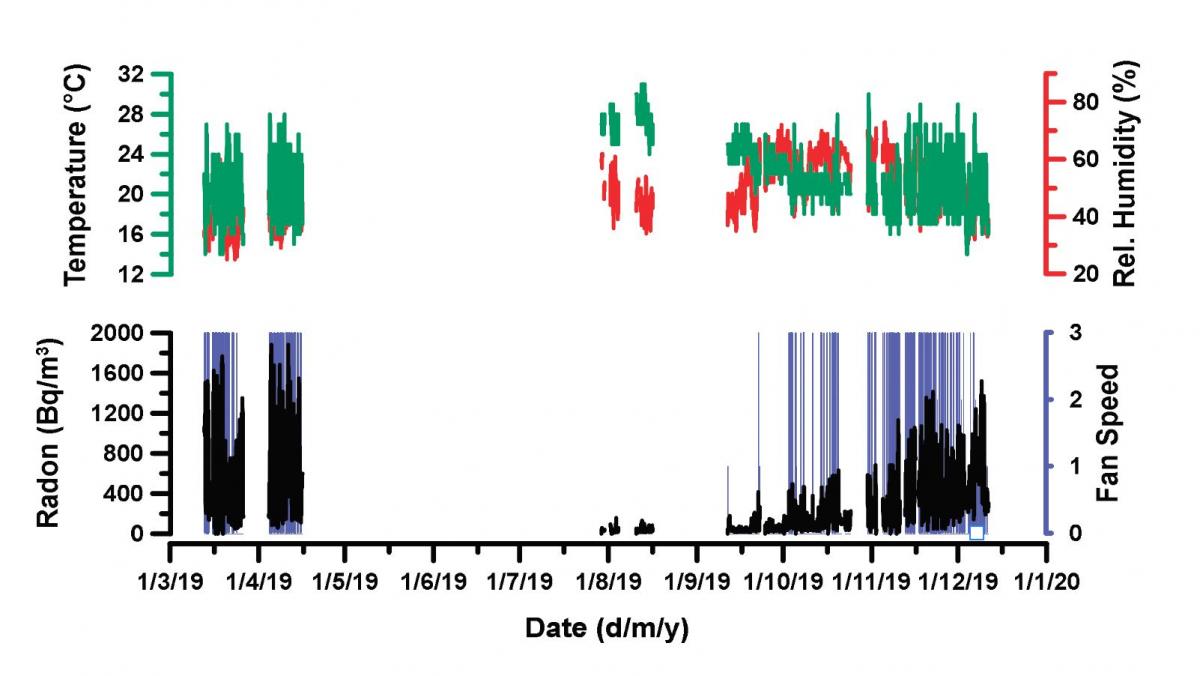
fan operation (blue), and radon concentration (black).